Business 3700 Practice Exercises for exam 3
Do these problems in Excel.
Question 1
A furniture store expects to sell 540 tables this year.
Each table costs 33 dollars to acquire from the supplier, and it costs
25 cents per dollar to hold inventory. Each time it places
an order it incurs a cost of 3.00 dollars. Determine the optimal
quantity to order, and the number of orders to place per year. (Round answers
to one decimal place.)
Question 2
You are given this regression result:
log S = 3.48 + 0.0148 t
where S = sales and t = time, measured in years.
(a) Determine the percentage growth rate of sales.
(b) What is the sales forecast when t=7?
Question 3
The following table shows the results of a multiple
regression calculation that attempts to forecast the value of sales
of computer games, using three independent variables:
X1 = average income (in thousands of dollars per year);
X2 = price of games; X3 = price of computers.
X1 Coefficient:       -32.0
   Standard error:      4.0

X2 Coefficient         14.0
   Standard error       3.0

X3 Coefficient         0.06
   Standard error      0.04

Intercept  2,600
(a) Which of these variables belong in the regression? Carefully
explain, using these results.
(b) What level of sales is predicted if
X1= 38,
X2= 32, and
X3= 988.0.
Note: include all three independent variables in the forecast,
even if the null hypothesis of no effect is accepted for some of them.
Question 4
For each of the following 3 parts, paste the data into Excel,
create a scatter graph of the x and y values, and determine
the r squared value, slope, and intercept for the regression line.
(In each case x is the independent variable and y is the
dependent variable).
Note: After you have pasted the data into Excel, most likely
all of the text will show up in one column. To separate them into
different Excel columns, go to the Data tab, then "Text to Columns."
The Text to Columns box allows you to separate data. For this
example, choose "Delimited", and then click on "Space" as the delimiter
character.
Part a
x	y
657	17780
889	13798
814	11531
401	8638
890	18419
203	13286
168	8257
138	13437
565	17219
371	13137
897	17521
92	4011
223	9842
523	11393
468	7047
232	8571
794	17722
520	11932
195	13416
900	21193
834	17784
692	15979
203	12007
852	15475
526	11545


Part b
x	y
657	9896
889	3130
814	1763
401	3826
890	7739
203	10850
168	6241
138	11781
565	10439
371	8685
897	6757
92	2907
223	7166
523	5117
468	1431
232	5787
794	8194
520	5692
195	11076
900	10393
834	7776
692	7675
203	9571
852	5251
526	5233

Part c
x	y
657	4631
889	4377
814	3838
401	2546
890	5186
203	2981
168	2036
138	2884
565	4357
371	3275
897	5042
92	1150
223	2418
523	3260
468	2396
232	2213
794	4881
520	3348
195	2989
900	5689
834	4968
692	4383
203	2758
852	4599
526	3292
Question 5
(a) Create a scatter graph for the following
values of x and y:
(b) Report the r squared, slope, and intercept
values for the simple regression with x as
the independent variable and y as the dependent
variable:
(c) Perform a multiple regression, using x and
x squared as the independent variables, and y
as the dependent variable.
x	y
9	4629
58	9872
49	9989
75	8325
41	9685
60	9780
73	8597
22	7424
23	7597
31	8765
63	9597
13	5597
93	4797
21	7245
35	9205
82	7184
9	4629
96	4020
21	7245
80	7540
3	2997
78	7872
35	9205
19	6869
45	9885


Regression Questions
	For each of the Questions below, perform a multiple regression
	calculation using Excel, and analyze the r^2 value and the
	t statistics.

 Question 6
x1	x2	x3	x4	y
28	35	12	69	70
34	21	60	44	15
97	65	69	46	1731
89	76	53	51	2072
60	90	51	56	2530
85	20	88	45	-50
84	64	67	9	2433
92	69	87	22	2370
62	75	95	59	1872
25	94	99	77	2271
48	64	76	92	770

 Question 7
x1	x2	x3	x4	y
67	36	0	67	84
68	64	96	81	90
49	1	31	96	78
14	60	22	92	27
73	69	31	8	85
88	33	55	95	9
36	98	60	93	41
19	78	6	25	88
79	46	49	8	2
86	5	51	17	10
10	54	52	88	2

 Question 8
 x1	x2	x3	x4	y
  2	7	97	29	602
  4	11	23	77	396
  6	15	16	88	481
  8	19	25	99	593
 10.01	23	83	42	747
 12	27	11	44	409
 14	31	24	89	545
 16	35	39	16	508
 18	39	43	80	738
 20	43	58	27	606
 22	47	20	68	542
Question 9
Click here to connect to a web page with data showing monthly
employment in the U.S.
Download the data into Excel and use Data / Text to Columns
to split the data values from the dates.
Perform a simple regression, using the logarithm (base 10)
of employment as the y range (dependent variable), and
a column with the numbers 1, 2, 3, 4, 5, ... as the
x range (dependent variable). Label this column "time"
since it is a measure of the time, measured in months.
Note: the first few logarithm values are given. Use the
Excel LOG10 function to calculate the remaining values.
After you have the regression result, then calculate
10 raised to the power of the coefficient of time to
get the value of g. Then, calculate
100*(g-1) to
get the average monthly percentage growth in employment.
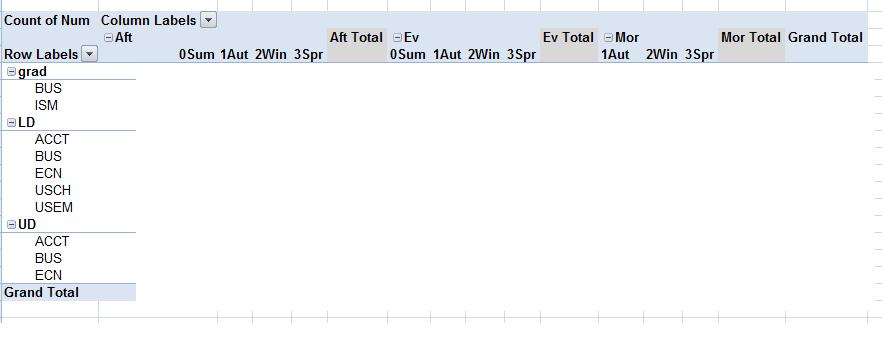
Question 10
Click here to download a spreadsheet
with time schedule information for School of Business and
Economics courses for a recent year.
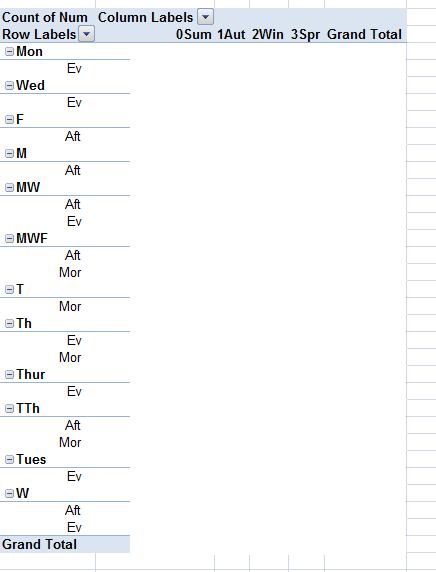
Create a pivot table for this information, and show
the class how to create these five different views.
Put the course number ("Num") in the "Values" field,
and change the "Value Field Settings" to "Count,"
not "Sum."
view 1 (all courses)
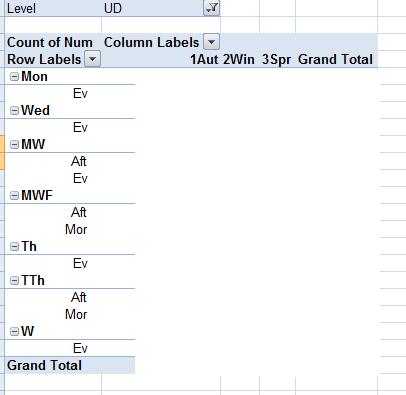
view 2 (upper division only). Move "Level" to the "Report Filter" box,
then click on the "Level" selector button and choose "UD".
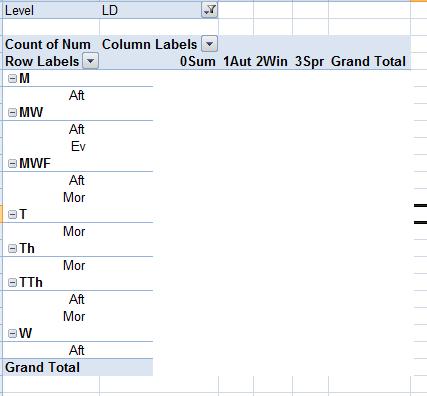
view 3 (lower division only) (set the "Level" to "LD")
view 4 (be sure to set the "Level" back to "All."
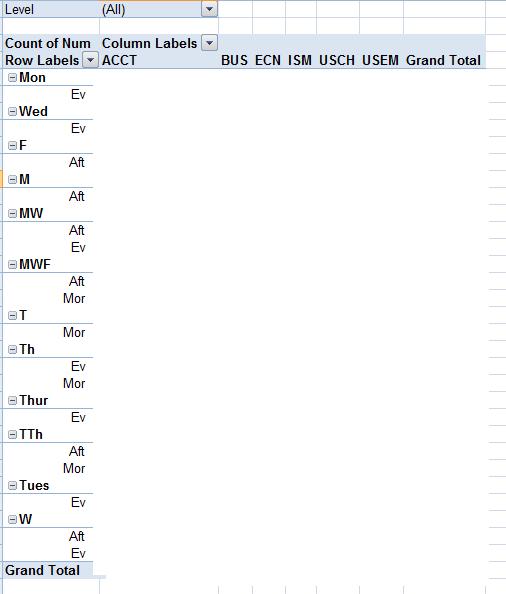
view 5